


Download PDF Report >>> Medicare Hospital Payments
SUMMARY – Medicare Hospital Payments
Medicare does not rely on hospital billings but on data built over decades as to the reasonable cost of services. Some may question the absolute amount of Medicare reimbursements but the relative payment scales are extensively validated by actual data. Conversely, this analysis shows hospital pricing has inconsistencies that cannot be rationally explained.
However, private insurers negotiate discounts from these hospital pricings. If billed prices are inconsistent, then so are discounts based on them. A major constraint on medical costs will occur when patients can make informed cost decisions at the DRG level, not just for overall premiums and co-pays. Currently, few persons can make those informed decisions.
Many states have enacted legislation for hospitals to be more transparent about their prices, but enforcement is spotty. This Medicare data suggests that the country would be well served if hospitals posted DRG prices for all to compare.
METHODOLOGY
In May, 2013 Medicare released its most comprehensive set ever of statistical data regarding hospital payments. The data covered fiscal year 2011 and included the top 100 DRG’s (diagnostic related codes) based on inpatient discharges. Data excludes DRG’s for hospitals with fewer than 11 discharges for that DRG. This allows focus on higher volume services and their financial impact. The final data set of the top 100 DRG’s results in over 166,000 records of nearly 7 million discharges from over 3,300 hospitals.
The data itself lists for DRG’s for each hospital, the number of discharges, the average covered (billed) charges, and the average total payment including Medicare. Each hospital, also includes its HRR (hospital referral region) which is the method governments use to determine “market areas”.
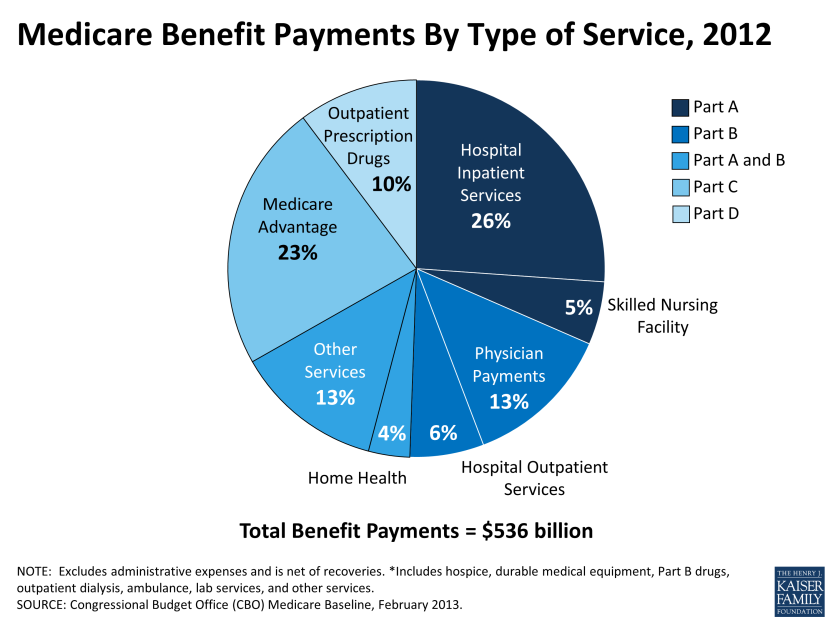
The chart below from Kaiser Foundation indicates that inpatient hospital is just over a quarter of Medicare spend or about $140 billion annually.
This analysis examines inpatient service pricing. Step one was to reduce the extreme data, both high and low. To minimize billing overstatement, this analysis removed 51 discharges that were high cost outliers. To minimize billing understatement, the smallest states totaling 10 % of the population and which tend to be more rural and variable were skipped. The sample data covers 6.3 million discharges from over 145,000 records of 100 DRG bills and costs. Total inpatient payments are $61 billion or 40% of total spend.
The data itself was analyzed five different ways.
- Percent of average paid vs. average billed, grouped by percent paid quartile
- Percent of average paid vs. average billed, grouped by state
- Variance from average of billed charges, grouped by state
- Variance from average of paid charges, grouped by state
- Extremes of 15 largest DRG groups expressed as a ratio of the maximum to minimum billed, along with the number of discharges included in each group
DISCUSSION
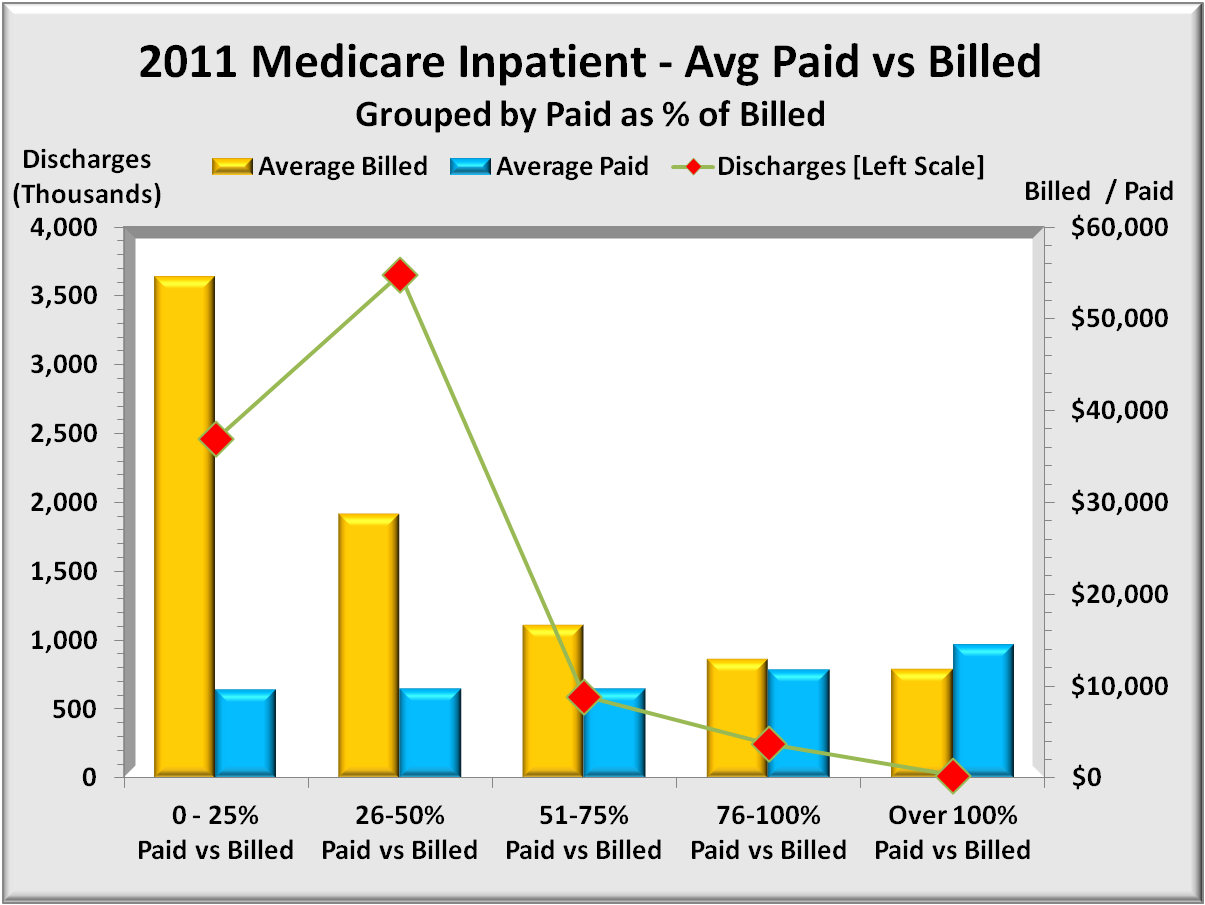
% average paid vs average billed, by % paid quartile
The graph below shows 5 sets of bars representing four quartiles 0% to 100% plus a small number of DRG’s that paid more than was billed. The left (gold) bar is the average bill for the four quintiles while the right (blue) bar is the corresponding average paid for each group. The right axis shows average dollars per discharge. Total average billed dollars is $36,384 and ranges from $54,000 highest to $11,867 lowest. Total average paid dollars is $9,754 and ranges from $14,481 highest to $9,548 lowest.
Note the inverse relationship of billed versus paid. One might expect higher billings to result in a lower percentage paid. What was not expected is that the actual dollars paid goes up as the overbilling goes down closer to paid dollars. Clearly billings for lower cost DRG’s bear little resemblance to cost.
% average paid vs. average billed, grouped by state
The graph below uses the same payment data above but groups results by state. And rather than two separate bars for billed and paid, there is one bar representing the percent of bill paid. (i.e. paid/billed) equivalent to the blue bar above.

This graph does highlight the extent of overbilling by state. It does not show either the billed amounts or the paid amounts. The graph begins with the states with the highest overbilling (and hence lower paid percent) and extends to more realistic levels of overpricing. Maryland at the bottom has billed prices very close to paid, with only a 6% discount to bill.
In the above graph, Illinois payments of 27% billed is the average for these 30 states. States listed above Illinois have more severe overpricing issues than states following Illinois.
“Discounts” from billed rates can have serious side effects. Just to call them discounts is something of a misnomer. For many, there seems little connection between what it costs and what is billed. Medicare of course ignores billed prices and pays what the procedures cost plus a margin. But private insurers do not have the extensive national database that Medicare has. Instead they negotiate “discounts” from billed or list price. But as this graph shows, and as one drills down deeper by hospital, these list prices are all over the map, and that alone can skew private insurance payment amounts.
But two other adverse factors also come into play. The most important is that billed rates are what uninsured people are charged when they require treatment. Most of the uninsured cannot afford the insurance, and should they be hospitalized, things get far worse. Over 60% of personal bankruptcies have medical bills as a significant factor.
Another adverse factor is that hospitals report the amount of uncompensated care that they provide, and are provided tax exempt status if that care exceeds a specific target, and/or get reimbursed for some of these expenses. The computations are far from transparent, and it is quite possible that taxes are avoided or reimbursements received that overstate actual uncompensated care were it calculated as Medicare does.
Variance from average of billed charges, by state
The graph below offers a more close-up view of overbilling. It shows how each state’s average dollar amounts differ from the 30 state billing average of $36,384.

Data is sorted from the most overbilling at the top to the least at the bottom. Note that Massachusetts, which state closely resembles the Affordable Care Act, has less overpricing (though still 50%) than all other states except Maryland.
Variance from average of paid charges, by state
The graph below is the same format as the prior except using paid instead of amounts. Its scale is also much lower. In the former graph, Maryland had the least overbilling. But as shown below, Maryland has the second most expensive payments following only slightly behind California.
This graph, more than any other highlights the cost-of-living differences between different parts of the country. Larger urban states tend to have higher costs than smaller less urban states. Nevertheless, the $5,000 difference between the extremes reflects costs nearly double from the lowest cost states to the highest. The financial effect (+30%/-40) seems larger than justified by differences in cost-of-living alone.

The most obvious difference would be intensity where higher cost states are able to justify more services. Another factor could be the use of more expensive equipment and methods.
Extremes of 15 largest DRG groups expressed as a ratio of maximum to minimum billed, along with the number of discharges included in each group
The graph below represents two different data, each with its own range of values. The grouping is a selection of 15 of the most frequent DRGs. The wider (green) bars have their value scale shown along the top. The wide bar represents the ratio of the maximum billing divided by the minimum billing – in other words, the ratio of maximum to minimum, the extremes of over-pricing. For instance, the second DRG, “Cellulitis” has its highest billing more than 70 TIMES that of the lowest bill. Bad as that is, the extreme for septicemia is over 100 times the lowest billing. These are extreme differences for closely related illnesses. Sure there are differences in how serious the illness is, but high-low factors greater than 50, not even considering ratios greater than 100 are hard to explain.

Then there are the narrow (gold) bars. They represent the number of discharges in each DRG group and whose values are shown below the graph. There are over 3.6 million discharges in the data. One may reasonably conclude that hospital pricing bears little relationship to costs of service. While deep discounts mitigate some of this, discounting just reduces the magnitude but not the irrational pricing itself.
Download PDF Report >>> Medicare Hospital Payments
Link to Medicare Provider Charge Data
Filed under: Analyses, Healthcare Reform, Kaiser Foundation, Medicare & Medicaid | Tagged: DRG, Hospital Billings, hospital cost, hospital discharge, medicare | Leave a comment »


Individual Mandate not necessary – But will you like the alternative?
Download PDF Report >>>Individual Mandate Alternative
SUMMARY
Of all the issues in the Patient Protection and Affordable Care Act (ACA or PPACA), one that has drawn an extraordinary amount of attention is the Individual mandate. Looked at in isolation, it may seem like an overreach. However, a broader view indicates why this provision or similar was included at all.
It is included because another section of ACA prohibits Health Insurers from rejecting people with pre-existing conditions as they do now. Some medical conditions may be avoidable, but the vast majority of pre-existing conditions occur through no fault of the individual. Insurance of all types is to spread risk, and the more skewed the risk the greater the need for insurance. Health costs are extremely skewed making health insurance vital to a modern economy.
ACA mandated that everyone buy insurance and that makes sense. However, the objection is forcing people to buy from a private company. There are several options to resolve that. One is to create a government-run insurer. That would eliminate forcing people to buy from a private insurer. A second is to make payment for any service obtained by an uninsured person a loan similar to student loans that could not be discharged for any reason. They would carry interest and be payable in full no matter the circumstances.
DISCUSSION
The percent of people with pre-existing conditions is small and to the majority of folks without such a condition, it may seem like a trivial matter. However, the number of people with pre-existing conditions is in the millions, and the cost to them has been and can be horrific. Medical expenses for these people have led to thousands of bankruptcies as health care costs sapped all their savings and more.
Insurers soon will be required to insure ALL persons regardless of medical condition. There is the very real risk of some people will avoid buying insurance, and then when they have an injury, or find they have a chronic condition like asthma or diabetes, they would only buy health insurance AFTER they know they have a medical condition.
One would think that any notion of personal responsibility would have all persons get insurance in order to spread health costs risks over the greatest population. The more people that buy insurance, the lower the cost per person. However, experience has shown that some people will NOT buy insurance if they feel they will not get sick or injured.
Fortunately, many employers offer health insurance for their employees, and by law, health insurers covering insurance through work (group insurance) MAY NOT exclude people with pre-existing conditions after some limited period of time, usually less than a year. However, the same did not apply to individuals until health care reform.
Note that employed individuals usually have access to health insurance. Full time employees, that is. With rising costs, what have many employers done including some of the largest? They have reverted to greater use of part time employees who do not enjoy the same privilege and access to health insurance as do full time employees. This is putting more pressure on reforming individual insurance plans.
People do not just dream up laws in a vacuum. Most fall into two categories. One is responses to maintain clean food, air and water, or help disadvantaged people, often the result of some abuse (social laws). The second are financial laws, like taxes or efforts to reduce taxes via special treatment for some (loopholes). ACA addresses the former by adding a financial provision, the individual mandate.
Everyone who works pays into social security and Medicare. Since Medicare is health insurance, there already is a mandate for working individuals to buy health insurance from the government. The only distinction is that Medicare is government-run insurance, while the ACA mandate applies to buying insurance from private companies.
ALTERNATIVE ONE
In the state run insurance exchanges to which any health insurer can join, add a government-run health insurer. Then the individual mandate does not require buying from a private insurer. However, if an individual decided against all private insurers they would have to buy the government-run insurance plan, just like Medicare and clearly legal.
However, politics intervened. Draft legislation DID INCLUDE a government-run insurer. They called it the “Public option”. It would operate on the same level field as private insurers and not be subsidized in any way. Private and government insurers would compete for business. Still, critics objected, and politicians stripped this provision from the final bill.
Why the objections? Perhaps it was fear of competition. To understand the public option, all one has to do is look at Medicare. Different in that it would cover people under 65 years old. In addition, women over 65 do not get pregnant, so there would be some differences in coverage.
What few know is government manages Medicare entirely through private health insurers. Insurers use a term Medical Loss Ratio (MLR) do describe how much of a premium dollar goes to pay health care costs. For Medicare, the MLR is over 95% meaning over 95 cents per premium dollar goes for health benefits. For private insurers, not so much. Their average MLR is in the low 80% range, and for individual insurance, which Medicare is, the MLR is even lower. How can private insurers compete with someone whose costs are less than one quarter of their own?
The honest answer is they cannot, at least not as currently structured. However, where does the constitution guarantee private enterprise continued profitability or even existence? “Destructive renewal” is a term used by business to explain competition that virtually by definition requires companies to fail as other more efficient companies market their goods and services for less; or whose new goods and services make prior ones obsolete (think cassette tapes).
It is worth noting that private health insurers used to have MLR’s in the mid 90%, but that was 30 years ago when nearly all insurers were non-profit. Over time, for-profit insurers became more prevalent, and as they did, they had to show a profit for their investors. Some admin efforts were devoted to marketing. Some to reducing costs. Some to profits. The net effect, however, is that far fewer dollars went for health care costs and more went for overhead and profits. Yet some of these same companies administer Medicare contracts for less than 5 cents on the dollar. What is apparent is that insurers could cut back on what it now costs them to weed out people with pre-existing conditions, but more efficiency are needed to compete.
ALTERNATIVE TWO
Set the ground rules for individual insurance similar to that of group insurance obtained through work. If a person elects not to purchase insurance, and gets sick or injured, a person could still buy insurance but the law would allow pre-existing exclusions to extend for one year. Also like group insurance, if a person previously had health coverage, and not more than 60 days elapsed without coverage, then the person could buy health insurance with no waiting period.
This alternative needs to have a bit more teeth to be effective. This is because there is a law that hospitals have to treat EVERYONE, regardless of ability to pay, and a healthy person could delay for years purchase of health insurance. They would only buy insurance when they get sick.
The current Medicare drug program provides a template for solving this issue. If a senior fails to purchase drug insurance, the premium continues to rise for as long as one remained uninsured. One can apply a similar index to health insurance. But how does one provide assurance of payment? Since the person required services, it should be legal to require the person to purchase insurance to pay for those services, and if the person is unable or unwilling to pay, the government could advance a loan similar to student loans.
That loan would bear interest, need to be paid over time (though shorter than for student loans), and could not be discharged by bankruptcy. If not paid by retirement, payments would be deducted from that person’s social security, just like student loans. Gone is the mandatory requirement. Replacing it is an automatic loan that the individual must repay in full with no exits.
Since the government would initially pay the hospital, it also could determine the ability to pay of the person getting treatment. If that person was indigent, they could be put on Medicaid, and no medical loan would be created. If the person’s income were within the subsidized amount, they would have been eligible for had they carried insurance, the loan would be reduced by the amount of the subsidy. Since the hospital is paid in full, there would be no cost shifting to those who bought insurance.
ALTERNATIVE THREE
As noted above, a law requires hospitals to treat EVERYONE, regardless of ability to pay. One could rescind that law and force everyone to either have insurance, pay for service, or be denied service. But few would be willing to take that backward step. From a practical standpoint, this is not a viable option.
Download PDF Report >>> Individual Mandate Alternative
Filed under: Commentary, Health Insurers, Healthcare Reform, Medicare & Medicaid, MLR - Financial Ratios | Tagged: 95% MLR, Affordable Care Act, drug insurance, federal mandate, Mandate, Mandatory health insurance, medicare, Medicare drug, PPACA, pre-existing conditions, Premiums, public option | Leave a comment »